Statistical Analysis
Dr. Andrew Besmer
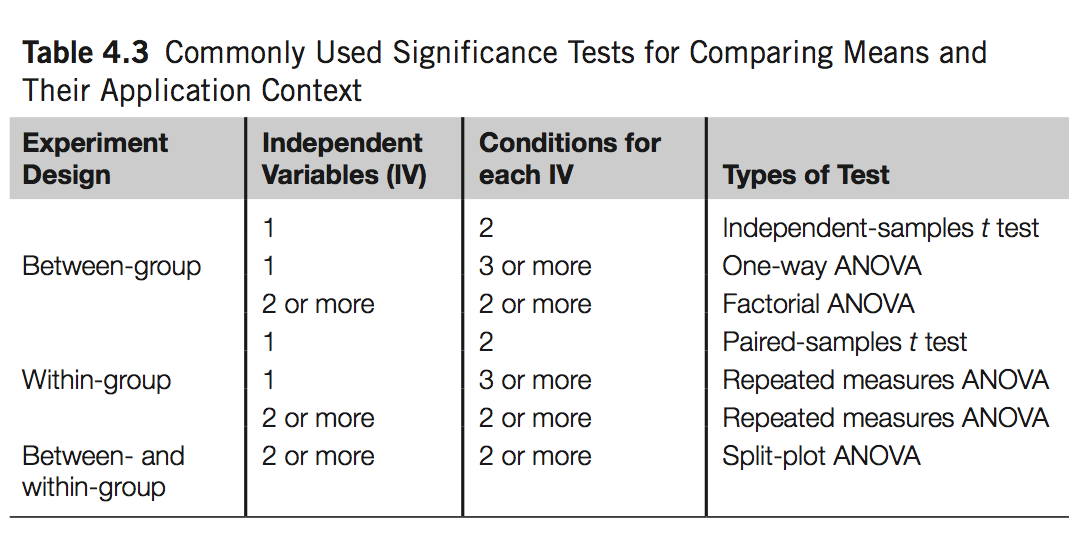
Comparing Means
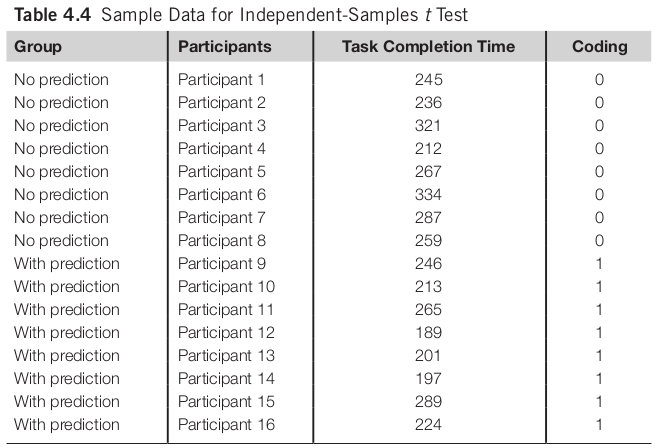
Layout of Independent Samples T Test
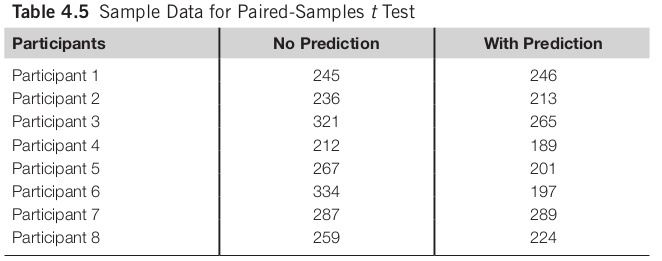
Layout of Paired Samples T Test
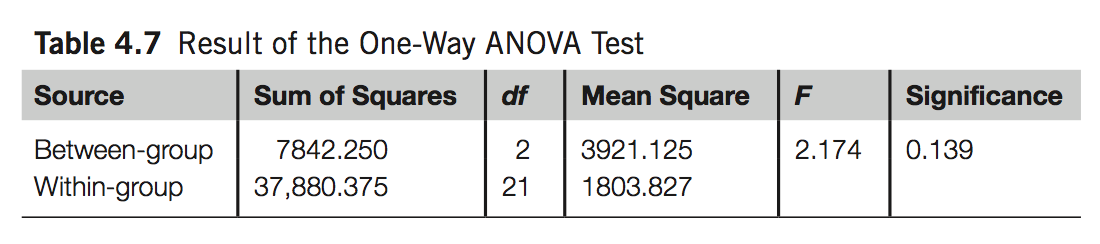
Comparing 2 or More Means
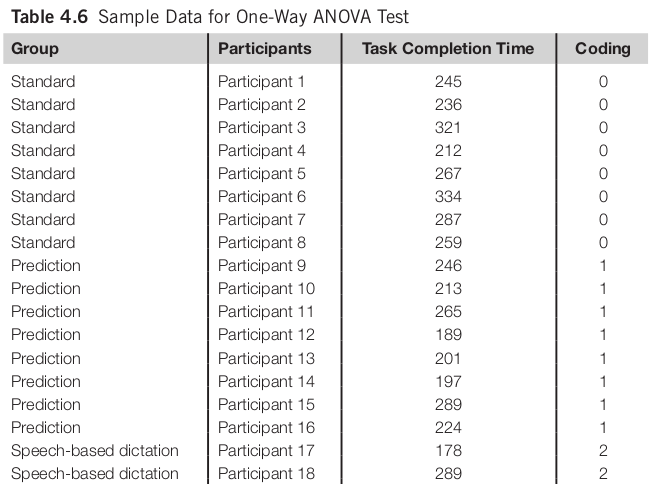
Comparing 2 or More Means
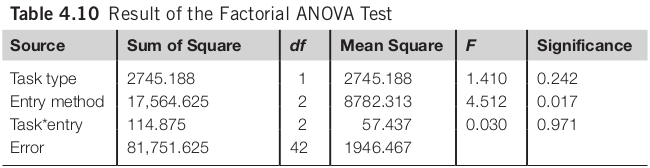
Factorial ANOVA
- For between-group design
- 2 or more independent variables involved
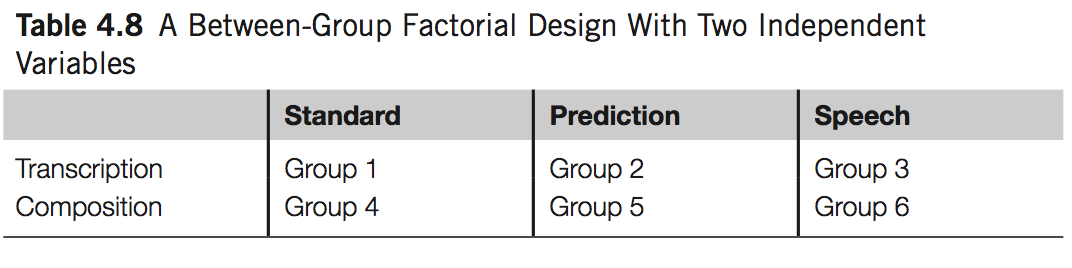
Factorial ANOVA
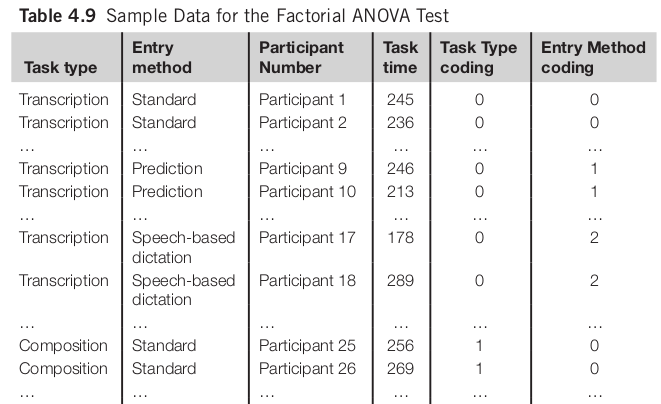
Factorial ANOVA
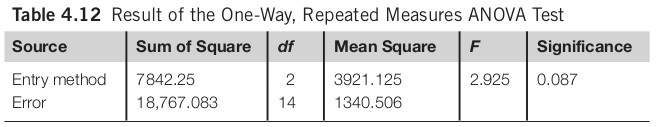
One Way Repeated Measures ANOVA
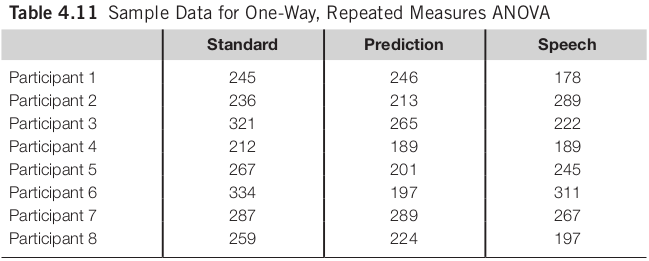
One Way Repeated Measures ANOVA
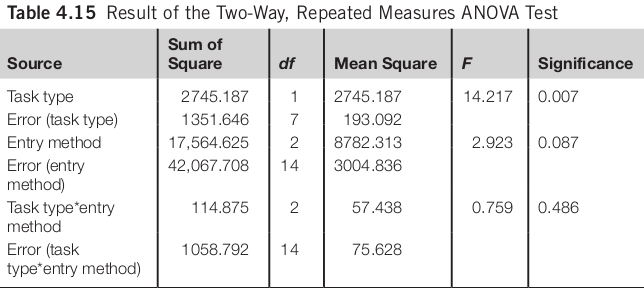
Two Way Repeated Measures ANOVA
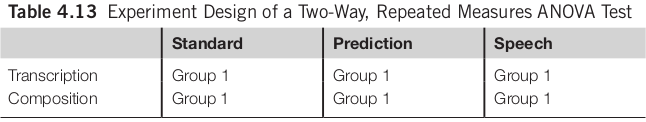
Two Way Repeated Measures ANOVA
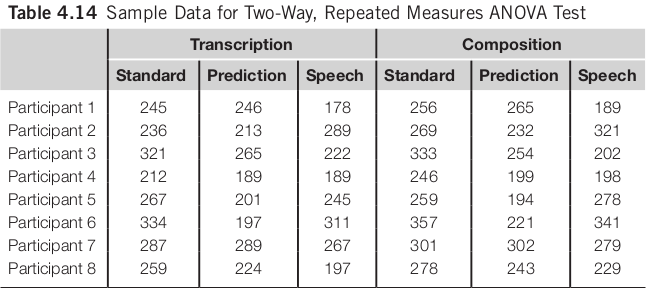
Two Way Repeated Measures ANOVA
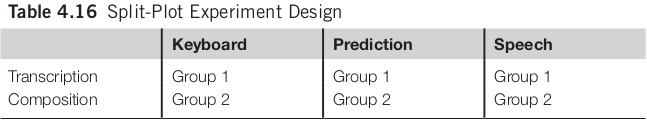
Split-Plot ANOVA
- Involves both between-group and within-group factors
- Between group task type, within group is entry method
- Reduces study time/participants needed
- Controls learning effect somewhat
Split-Plot ANOVA
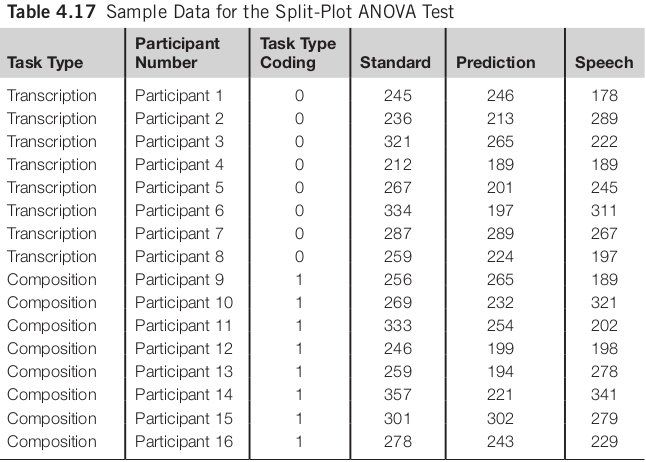
Split-Plot ANOVA
- Between Group Variable (Task Type)
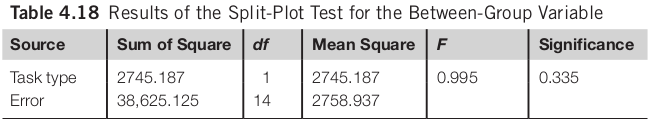
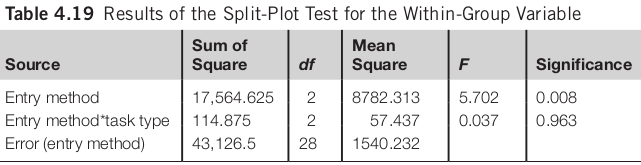
Split-Plot ANOVA
- Within Group Variable (Entry Method)
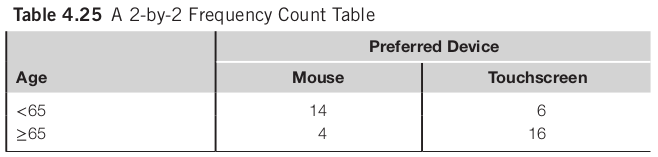
CHI Squared Test
- Used to analyze categorical data
- Table of frequency counts (contingency table)
- Degree of freedom = ( Number of rows - 1 ) x ( Number of columns - 1 )
- Assumptions of the test
- Data points need to be independent
- The sample size should not be too small
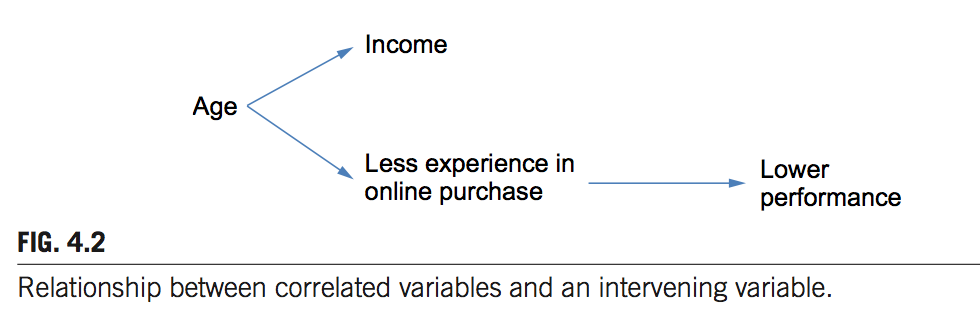
Identify Relationships
- Correlation does not imply causal relationship
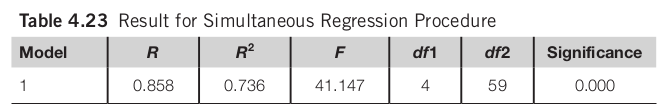
Simultaneous Regression
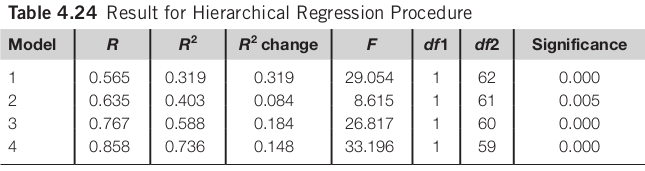
Hierarchical Regression