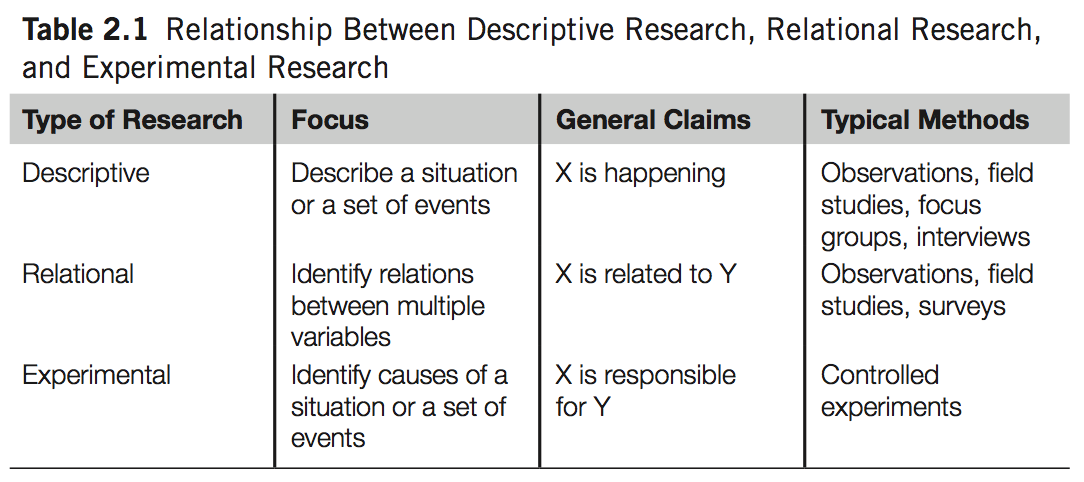
Experimental Research
Chapter 2
Dr. Andrew Besmer
Experimental Research
Catagories
- Three broad categories
- Descriptive
- E.g. Observations, focus groups
- Consider 8/10 who can play game and type fast
- Interesting phenomena but not relationship
- Descriptive
Catagories
- Three broad categories
- Relational
- E.g. Correlation Analysis
- Consider hours played and words per minute
- Relationship but not causality
- Relational
Catagories
- Three broad categories
- Experimental
- E.g. Treatment Study
- Consider a control and treatment
- Causality can be established
- Experimental
- Types of studies are not totally independent
Catagories
Getting Started
- Start with a research hypothesis
- Study built around this
- Basis for statistical tests
- Theory vs Hypothesis
- Theory: Fitts Law - Time increases as distance increases and target size decreases in movement tasks.
- Hypothesis: Mouse, Touch, etc…
Hypothesis
- Null (\(H_0\)) vs Alternative (\(H_1\)) Hypothesis
- Null hypothesis states that there is no difference between experimental treatments
- Alternative hypothesis is mutually exclusive the null
- Some experiments have several
Hypothesis
- Experiment to determine which menu design allows users to navigate a site more effectively
- \(H_0\): There is no difference between pull down and pop up menus in time spent locating pages.
- \(H_1\): There is a difference between the pull down and pop up menus in time spent locating pages.
- Statistical test will tell us whether it is reasonable to reject the null hypothesis and the likelihood of being wrong
Testing Hypothesis
- You can test multiple hypothesis
- No limit but…
- More factors to control for
- Increased possibility of flaw
A Good Hypothesis
- A good hypothesis generally:
- Is presented in clear, precise language
- Is focused on a problem that is testable in a single experiment
- Clearly states the control group or conditions of the experiment
Variables
- Different Types of Variables
- Independent - What we are studying, changing, or might cause a change
- Think treatments or conditions that researcher controls
- E.g. Menu type
- Independent - What we are studying, changing, or might cause a change
Variables
- Different Types of Variables
- Dependant - The variables being measured that is dependent on participants behavior or change in the independent variable
- Think outcomes
- E.g. Time locating page
- Some faster than others, more experienced, …
- Dependant - The variables being measured that is dependent on participants behavior or change in the independent variable
Independent Variables
- Typical Independent Variables
- Devices
- Modalities
- Designs
- User characteristics
- Age, experience, mood, profession
Dependent Variables
- Dependent Variables usually one of 5 groups
- Efficiency
- Accuracy
- Subjective Satisfaction
- Learning/Retention
- Physical/Cognitive Demand
- Efficiency and Accuracy are usually, but not always, related
Controlling Factors
- Experimental Research allows for controlling of factors
- Randomized design
- No one, including investigator, can predict which treatment group is used
- Controls for intentional or subconscious influence of hidden factors
Controlling Factors
- Randomization measures
- Tossing a coin
- Throwing dice
- Software, etc…
- Uniform Distribution Example - Histogram & Random Data
Design Types
- Consider comparing QWERTY to DVORAK
- Need participants that have used neither or highly biased
- Between-Subjects Design
- Assign randomly to each group and measure
- Within-Subjects Design
- All participants use both and are measured
- Mixed Factorial
- Combination of both
Counterbalancing
- Measuring participant more than once?
- Each participant does Task A, Task B, Task C
- Several problems
- Carryover effect
- Fatigue effect
- Context effect
Counterbalancing
- Measuring participant more than once?
- Should counterbalance assigning order randomly
- Consider using Latin Squares - ABC, ACB, BAC, BCA, CAB, CBA
- Mitigates confounding ordering effects
- Potentially allows for studying the problem ones, e.g. carryover
- Should counterbalance assigning order randomly
Significance Testing
- Nearly all experimental investigations use statistical significance testing
- Consider two statements:
- Mike’s height is 6′2″. Mary’s height is 5′8″. So Mike is taller than Mary.
- The average height of three males (Mike, John, and Ted) is 5′5″. The average height of three females (Mary, Rose, and Jessica) is 5′10″. So females are taller than males.
- Population vs Sample
Normal Distribution
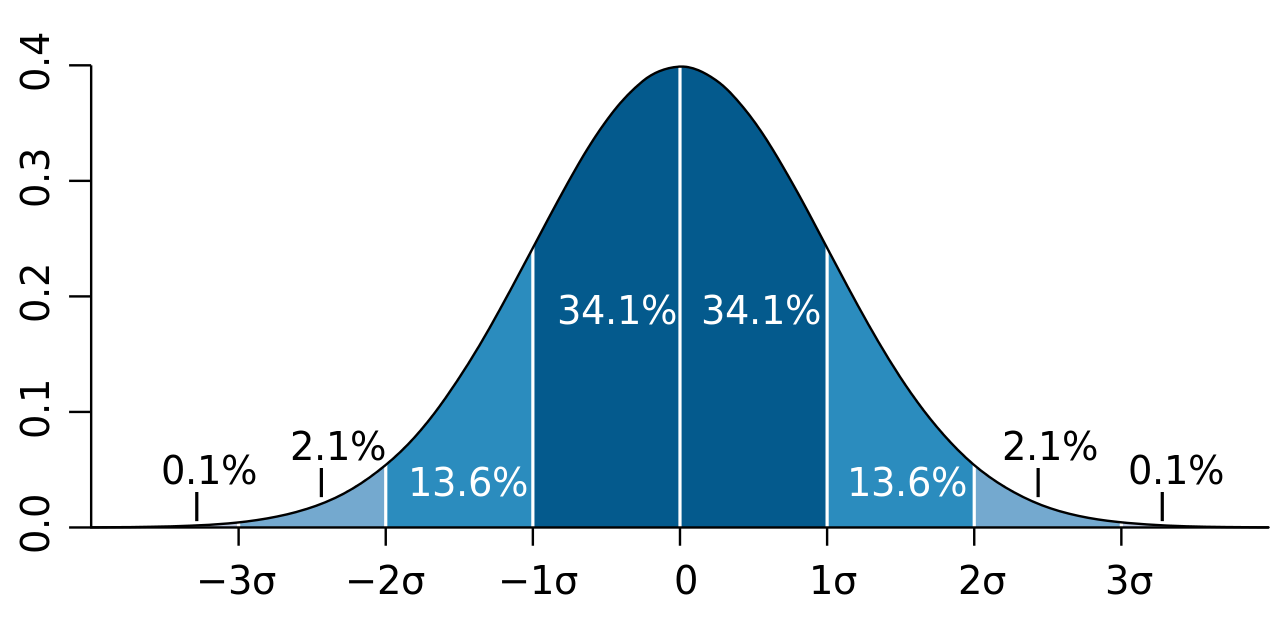
Significance Testing
- Use statistical test to help us be confident the result applies to the entire population
- For example, t-test with \(p < .05\) would indicate we are 95% certain the result applies to the general population
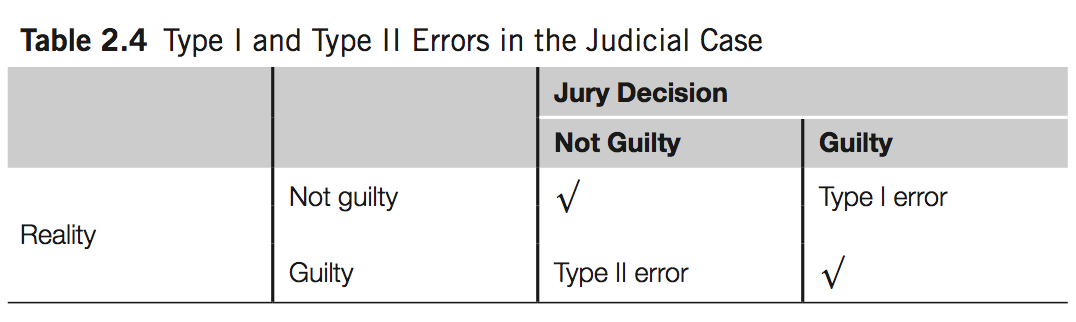
Type I & II Errors
- Allows us to contrast \(H_0\) and \(H_1\) to determine the likelihood the null hypothesis (\(H_0\)) is true
- All significance testing is subject to Type I and Type II error
- Type I - “false positive” or rejecting the null hypothesis when it should not be
- Type II - “false negative” or accepting the null hypothesis when it should be rejected
Type I & II Errors
- Consider a court case where we presume the defendant is innocent
- \(H_0\): The defendant is innocent
- \(H_1\): The defendant is guilty
- Both errors have very real costs
Type I & II Errors
Try It
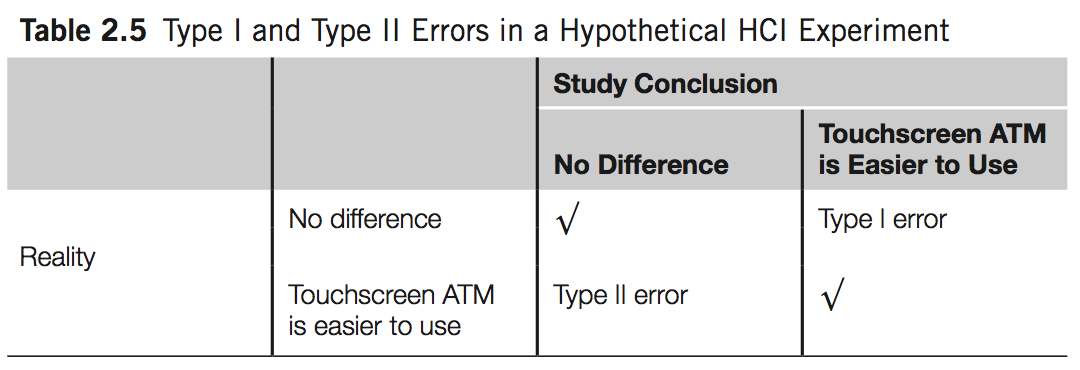
- Consider a bank that wants to understand if ATMs with a touch screen are easier to use than ATMs with buttons
- In groups:
- Identify the \(H_0\) and \(H_1\)
- Identify Type I and II Errors
- Identify the \(H_0\) and \(H_1\)
Try It
- Answer:
- \(H_0\): There is no difference between the ease of use of ATMs with touch screens and ATMs with buttons.
- \(H_1\): ATMs with touch screens are easier to use than ATMs with buttons.
Try It
Type I & II Errors
- Generally believed that Type I errors are worse than Type II
- Type I is a mistake that involves “gullibility” and potentially results in a worse current state
- Type II involves “blindness” and potentially loses ability to improve current state
- Consider medication study involving Type I and II errors
Type I & II Errors
- Type I is called alpha or significance level or p value
- Type II is called beta
- Alpha and beta are related, becoming less gullible means increased blindness
- \(p=.05\) is widely used
Hawthorne Effect
- Consider limitations e.g. “Hawthorne effect”
- Short term improvements not lasting after observation
- Incentive, stress, environment and so on
Experiments
- Experimental approaches are effective ways to generalize to larger populations
- Must be successfully designed and carried
- Must deal with potentially confounding variables
- Random + increased sample size
- Explicitly control for
- Use as covariable
Questions
- Questions?