Experimental Design
Chapter 3
Dr. Andrew Besmer
Experimental Design
Studies
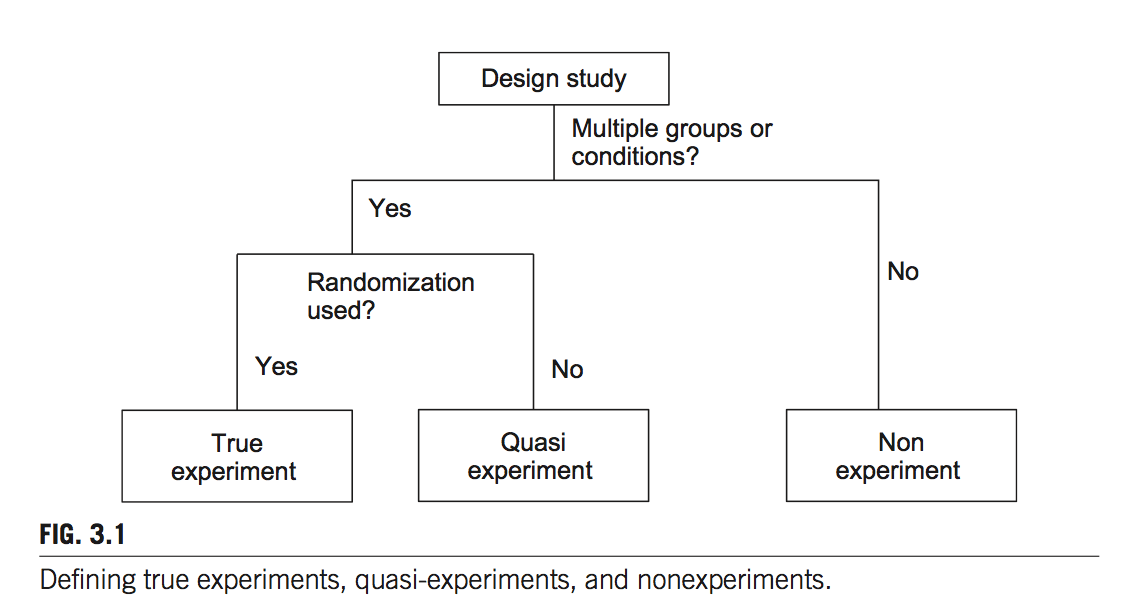
True Experiments
- Based on a hypothesis
- Have conditions to be tested
- One or more dependent variables can be measured
- Uses statistical tests
- Systematically removes or controls biases
- Can be replicated
Considerations
- Research hypothesis
- Clearly defined
- Appropriate scope
- Dependent variables
- Easy to measure
- Independent variables and controls
- Easy to control
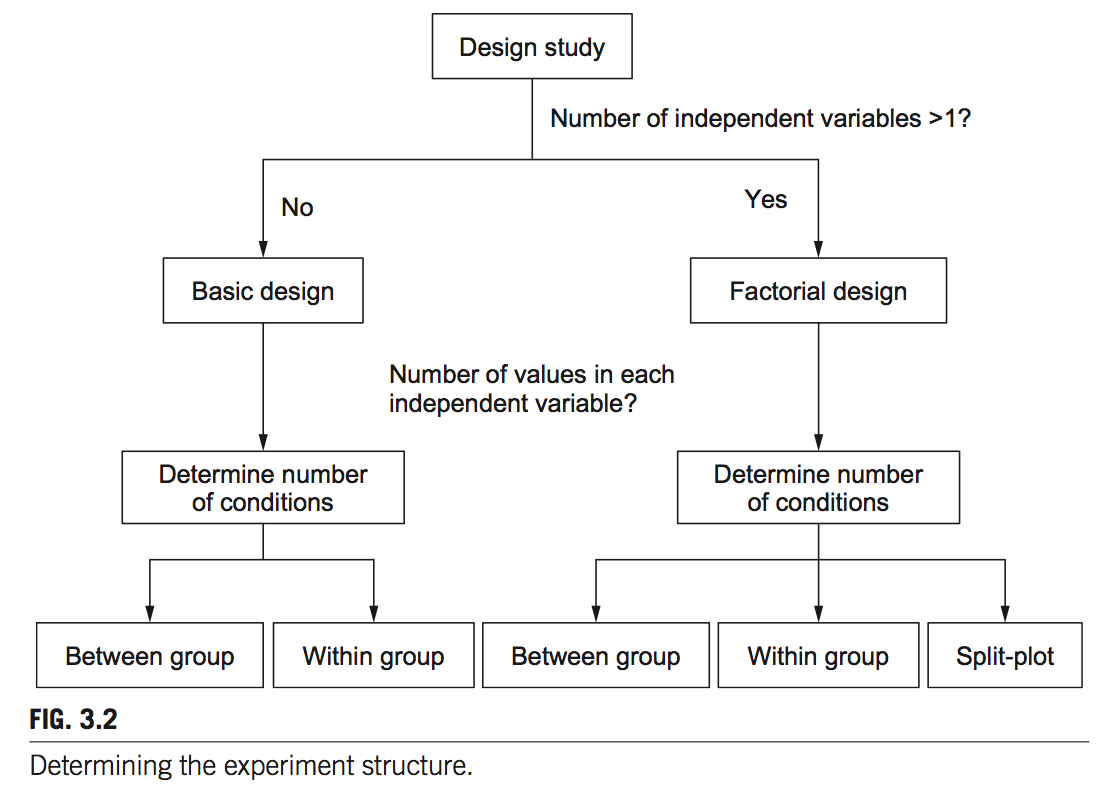
Basic Structure
- How many IVs do we want to have?
- How many values for each IV?
- Lets look at one IV
Basic Structure
One IV
- What are the IVs? How many conditions?
- H1: There is no difference in typing speed when using a QWERTY keyboard, a DVORAK keyboard, or an alphabetically ordered keyboard.
- H2: There is no difference in the time required to locate an item in an online store between novice users and experienced users.
One IV
- What are the IVs? How many conditions?
- H3: There is no difference in the perceived trust toward an online agent among customers who are from the United States, Russia, China, and Nigeria.
- Now we can chose design
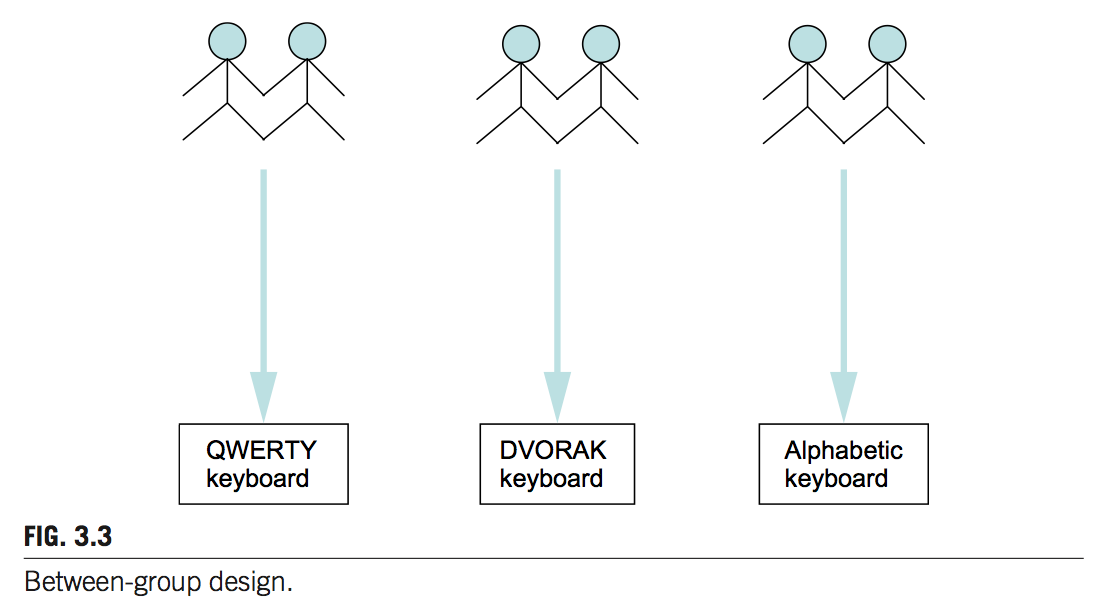
Between Groups Design
- Between Groups/Subjects Design
- One participant goes to one condition
- Random assignment when can, if assigning, counterbalance
- So how many groups will we have?
- One participant goes to one condition
Between Groups Design
- Advantages
- Better control
- Generally requires less time per participant
- Fatigue, Frustration issues avoided
- Disadvantages
- May be individual differences
- Type II error more likely
- Higher \(n\) and random sample dilute
- Requires a larger sample size
- May be individual differences
- How many participants would you need?
Between Groups Design
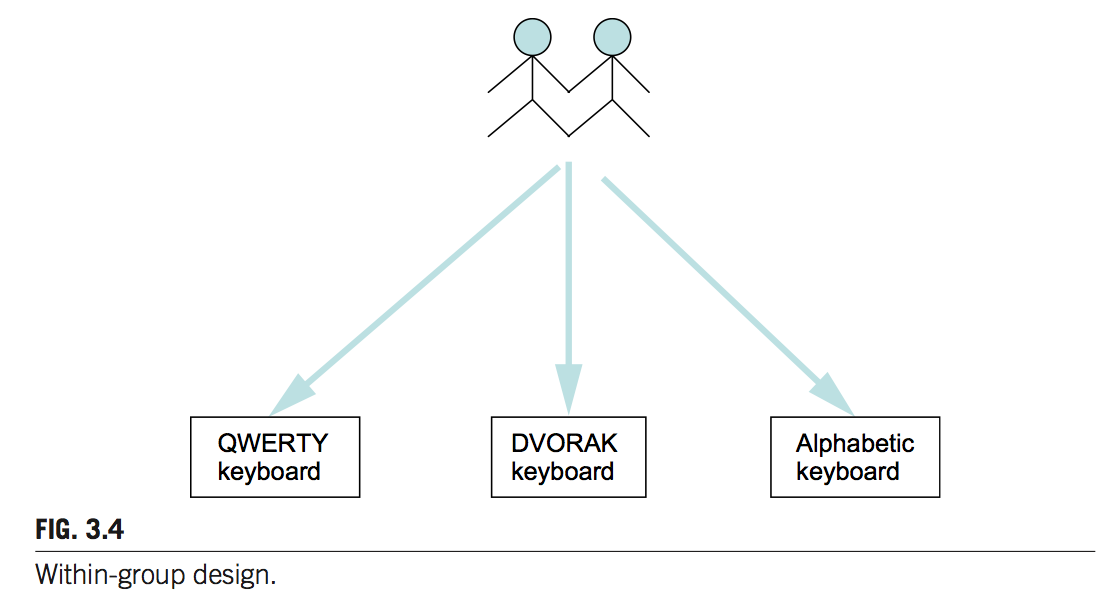
Within Groups Design
- Within Groups/Subjects Design
- One participant gets multiple treatment conditions
- So how many groups will we have?
- How many participants needed?
Within Groups Design
- Advantages
- Smaller sample sizes
- Difference between conditions more detectible (less “noise”)
- Less expensive if providing inducement
- Disadvantages
- Learning effects
- Consider Latin Square Design to attempt to mitigate
- Participants must spend longer time increasing fatigue, frustration
- Learning effects
Within Groups Design
When To Use
- Choosing is hard, disagreements happen
- Use between group when you have
- Simple tasks
- Potential for large learning effects
- Within-group is not feasible
- Use within groups when you have
- Small participant pools
- No or small learning effects (Fonts and reading speed)
- Substantial cognitive/perceptual capabilities
Practice
- For H1, H2, H3 choose which design you would use?
Factorial Design
Factorial Design
- Allows for multiple IVs with different levels
- Number of conditions defined as
\(C = {\displaystyle \prod_{a=1}^{n} V_a}\)
- \(C\) - Number of conditions
- \(a\) - Each IV \(\{1, 2, ..., n\}\)
- \(V_a\) - Number of levels in IV \(a\)
- \(\prod\) - Product operator
More Than One IV
- What are the IVs? Levels? How many conditions?
- H4: There is no difference between the target selection speed when using a mouse, a joystick, or a trackball to select icons of different sizes (small, medium and large).
- How many total conditions are there?
Factorial Designs
- Three Options
- Between Groups
- Within Groups
- Split-plot (Has both of former components)
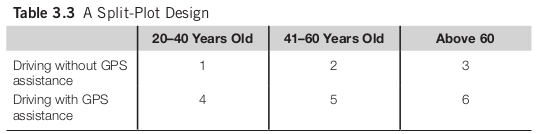
Split-plot
- One or more IVs chosen as between groups and rest assigned to within
- Consider looking at driving time with age (between) and gps use (within) as the IVs in a split plot
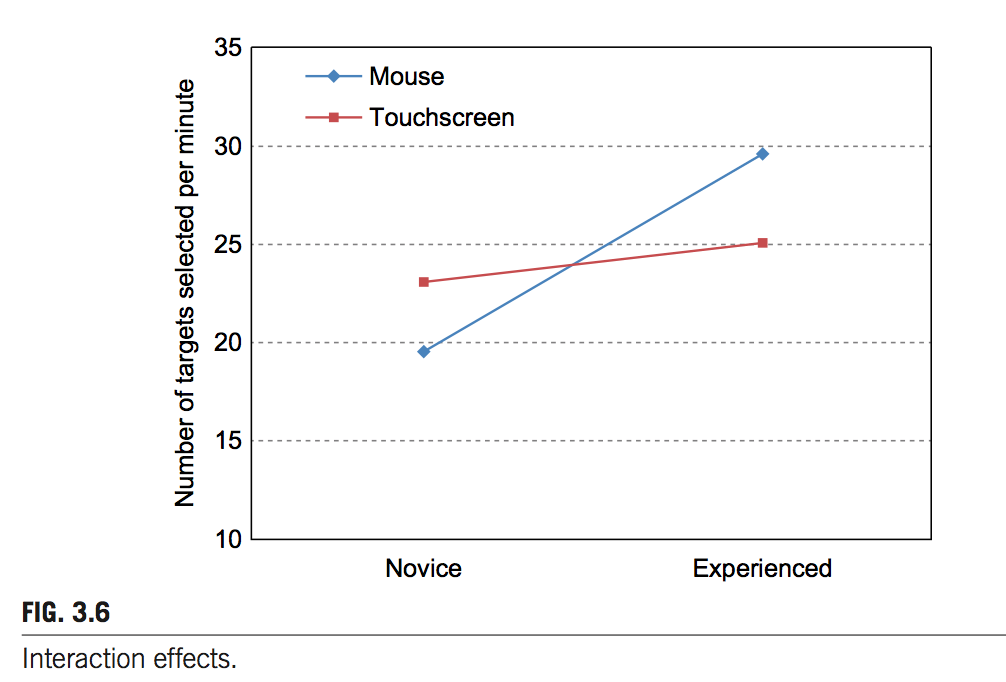
Interaction Effects
- Allows study of IV’s as well as potential interaction effects
- Interaction Effect - The differing effect of one independent variable on the dependent variable, depending on the particular level of another independent variable
- “When a significant interaction exists between independent variables X and Y, the means of the dependent variable Z would be determined jointly by X and Y.”
Interaction Effect
Replication
Random Errors
- HCI vs Physics studies have higher variations and thus lower ability to reproduce due to random error
- Can be described as \(Observed Value = Actual Value + Random Error\)
- Random error pushes actual value up/down and can not be directly controlled for
- Higher \(n\) can bring resulting observed values closer to actual as highs and lows offset each other
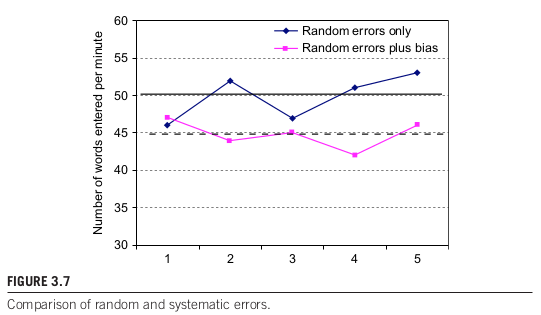
Systematic Error
- The result of “biases”
- Always push actual values in the same direction resulting in biased observed values
- Can NEVER be offset by increasing sample size
- Reduce reliability of research
- Should be eliminated
Systematic Error
- Typical sources
- Measurement instruments
- Participants
- Experimenter behavior
- Environmental
- Experimental procedures
Measurement instruments
- Stopwatch operated by human vs instrumentation
- Accuracy of measurements themselves
- Pressure sensitive keyboard
Participants
- Participant representation of target demographic
- Recruitment sources
- Put at ease, you are testing X, not them!
- Reschedule if participant is tired, stressed, etc…
Experimenter Behavior
- Intentional
- Unethical
- Hurts all of research
Experimenter Behavior
- Unintentional influence
- Facial expression, body language
- Altering perception
- “Now try X I designed it myself.”
- Unlikely to share negative subjective data
- Facial expression, body language
Experimenter Behavior
- Unintentional influence
- Loading website: “Wow this is loading slowly”
- Negatively priming
- Tapping fingers
- Increasing participant stress
- Loading website: “Wow this is loading slowly”
Experimenter Behavior
- Unintentional influence
- Late and missing task list
- Investigator is not taking serious
- Participant may not either
- Late and missing task list
Experimenter Behavior
- Train in being calm, neutral, and patient
- Have multiple investigators, one primary running it, second observing taking notes of issues
- Use written documents and detailed procedures including speech
- Record important instructions and play them for participants
Environmental
- Physical
- Noise
- Temperature
- Lighting
- Vibration
- Humidity
Environmental
- Physical
- Usually aim for clean, quiet, well lit environment in a lab setting
- When possible use one way mirror for observation
Environmental
- Social
- Number of people present
- Relationship to people
- Presence of investigator, e.g. watching over shoulder
Experimental Procedures
- Effects Identified and Mitigated
- Learning effects
- Frustration
- Instructions
- Should be scrutinized
- “complete as quickly as possible”
- “take your time, there is no rush”
- Should be consistent
- Multiple investigators
- Use scripted if possible
- Should be scrutinized
Experimental Procedures
- Pilots
- Run practice study for purposes of uncovering issues
- Helps identify issues before data collection
- Pilots are absolutely needed to identify issues and biases
- These are not a luxury
Replication
Misc
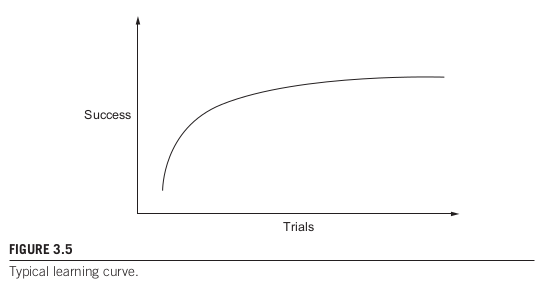
Controlling Learning Effect
- Consider providing opportunity for learning
- Learning curve is typically steep
![Figure 3.5]()
- Learning curve is typically steep
Study Time
- Maximum time should be 60-90 minutes
- Participants become tired, frustrated
- Performance is typically impacted
- Over 2 hours generally considered a bad idea
- Provide for breaks
- Suggesting, even encouraging them, may not be enough
Controlling IVs
- Controlling IVs sometimes very hard
- Consider
- Study of speech recognition system in understanding the impact of recognition errors on user behavior.
- Control condition have no recognition errors?!?
Controlling IVs
- Possible solution is Wizard of Oz study
- Human typist listens to audio and transcribes
- Not revealed until later in the study
- Able to study conditions not easily studied in real world
- Still possible human introduces errors in the control
Running Experiments
Lifecycle
- Identify a research hypothesis
- Specify the design of the study
- Run a pilot study to test the design, the system, and the study instruments
- Recruit participants
- Run the actual data collection sessions
- Analyze the data
- Report the results
Typical Session
- Preparation
- Greet participants
- Introduce the purpose of the study and the procedures
- Get consent
- Assign participants to a specific experiment condition
Typical Session
- Training task(s)
- Actual task(s)
- Participants answer questionnaires (if any)
- Debriefing session
- Payment (if any)
Questions
Questions
- Questions?